One platform to govern every device,
AI to watch every second
From servers to switches, from virtual machines to public cloud, from alerts to self-healing — ZABBIX enterprise monitoring plus AIOPS automated operations plus the OpenClaw AI Agent. Three products, one solution, so your operations team moves from firefighting to fire prevention.
Too many devices to watch
Servers, switches, virtual machines, containers, cloud hosts — spread across several platforms with no single place to see the whole picture.
A pile of alerts, no root cause
Fifty alerts at midnight — is it the network or a full disk? After digging through Zabbix you find it was unreleased PGSQL connections.
Reports are all manual
Weekly and monthly reports mean exporting from Zabbix, pasting into Excel and emailing around. Half a day per report, with inconsistent formatting.
Multi-cloud blind spots
One tool for VMware, another for Alibaba Cloud, a third for K8s — when something breaks you do not know which platform to look at.
ZABBIX + AIOPS + OpenClaw
Monitoring finds the problem → AI analyses it → the Agent fixes it. A three-step closed loop that does not need someone watching.
ZABBIX enterprise monitoring
Enterprise Monitoring Platform
This is not open-source Zabbix installed and handed over. We deliver full localisation, standardised templates, a distributed Proxy architecture and high-availability deployment — ready to use and supporting 100,000+ devices. Private cloud, public cloud, physical servers, virtual machines and containers fully covered.
AIOPS automated operations
AI-Powered Operations
Connected to Zabbix alert data, the AI analyses root causes automatically, generates inspection reports automatically and triggers fault self-healing automatically. Daily, weekly and monthly reports are distributed automatically; common faults are handled in seconds — no more overnight on-call rotas.
OpenClaw AI Agent
Natural Language Operations
Send one message to the bot in Lark, DingTalk or WeCom — "show me the 7-day CPU trend on the database servers" — and OpenClaw pulls the data from Zabbix, computes the metrics and produces the chart. Operations work can be done in natural language too.
Standardised localisation
Items, triggers, tags, host groups and templates — every metric localised and named to a consistent convention. A newcomer understands it on day one, without guessing at jargon.
High-availability architecture
Active-active Zabbix Server HA, running 24×7 with automatic failover and zero data loss. It is not "wait for someone to fix it" — it fails over to the standby automatically.
Distributed Proxy
For multi-site and multi-campus scenarios, deploy Proxy nodes for local collection with central management. Components communicate with native encryption, so distance does not mean exposure.
Automated reporting
Daily, weekly and monthly reports generated and distributed automatically. Management sees system health, operations sees performance trends, audit sees compliance records — one dataset, different views.
Visualisation dashboards
Our own alert wall and IT operations overview dashboards, built for the duty room and management. The data comes from Zabbix; the interface is ours, not the stock charts of an open-source tool.
100,000+ devices managed
Supports very large environments above 100,000 devices. The distributed architecture keeps things stable at scale — it does not slow down as device count grows.
Wherever your systems run, one platform covers it
It is not just physical servers. Virtualisation, containers, private cloud, public cloud and hybrid cloud each have a matching collection method.
VMware vSphere
Direct vSphere API: monitor ESXi/vCenter hosts, virtual machines and storage clusters
Microsoft Hyper-V
PowerShell collection of host and VM CPU, memory, disk and network
Nutanix AHV
Prism API collects HCI CVM, virtual machines and distributed storage IO
Docker
Docker API auto-discovers containers and monitors resource use and start/stop state
Kubernetes
Standard K8s API: monitor nodes, Pods, containers and control-plane health
OpenStack
Native API monitoring of compute nodes, cloud hosts, block storage and tenant resources
Alibaba Cloud
Open API collection of ECS, ACK, OSS and RDS performance and alerts
Huawei Cloud
SNMP + API management of compute, storage and network resources
AWS
CloudWatch interface collecting EC2, EKS, RDS and S3 performance
Azure
Azure API managing cloud hosts, AKS, storage load and quotas
GCP
GCP Monitoring API managing GCE, GKE and cloud storage
H3C cloud platform
CVK virtualisation nodes, distributed storage and virtual networking
Sangfor SCP
SCP platform monitoring of virtualisation nodes, distributed storage and VMs
Proxmox VE
Proxmox API collecting nodes, LXC and QEMU virtual machines
On-premises virtualisation
API or custom scripts collecting local virtualisation instance resources and state
More platforms
SNMP, IPMI, JMX and custom scripts connect any device
Not the stock Zabbix charts, but what we built
Zabbix's native interface is made for monitoring engineers. These two dashboards are for our customers — management, the duty room, wall display. The data comes from Zabbix; the interface is our own.
Live alert monitoring
Alert wall
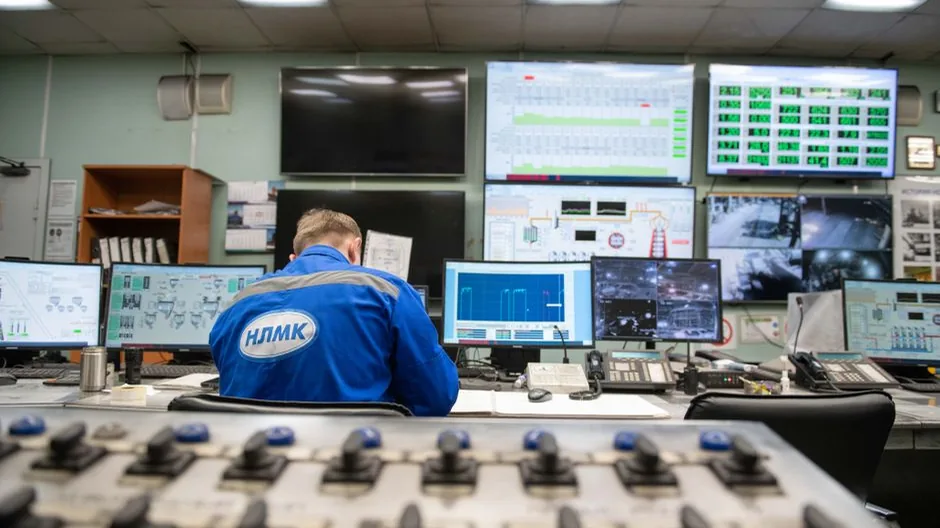
The screen on the duty-room wall. Every critical alert pops up in real time with sound and light alarm, so operators do not have to keep refreshing a Zabbix page. Anyone walking past can see at a glance whether the system is stable today.
- Three-level critical / warning / normal classification with live counters
- Alert list scrolls automatically, newest first
- Sound and light alarm — critical alerts ring and flash red
- Multi-dimensional filtering by host group, severity and time range
- Resolved alerts turn green and drop off automatically, leaving no clutter
Device health TOP 5
Network bandwidth trend (24h)
IT operations overview dashboard
The global view for management and the IT director. How many devices are managed, what the availability rate is, how many critical alerts are firing, how hard the egress link is working — one screen explains the whole IT estate.
- Four core KPIs pinned to the top: device count, availability, alerts, bandwidth
- Device health TOP N ranking to pinpoint the problem machine at a glance
- 24-hour network bandwidth trend with peak hours flagged in red
- Multi-dimensional panels for alert distribution, availability and storage usage
- 1080p/4K wall display with adaptive resolution
Not mock-ups — these are running in customer production
AU Optronics
Optoelectronics · Multi-site manufacturing
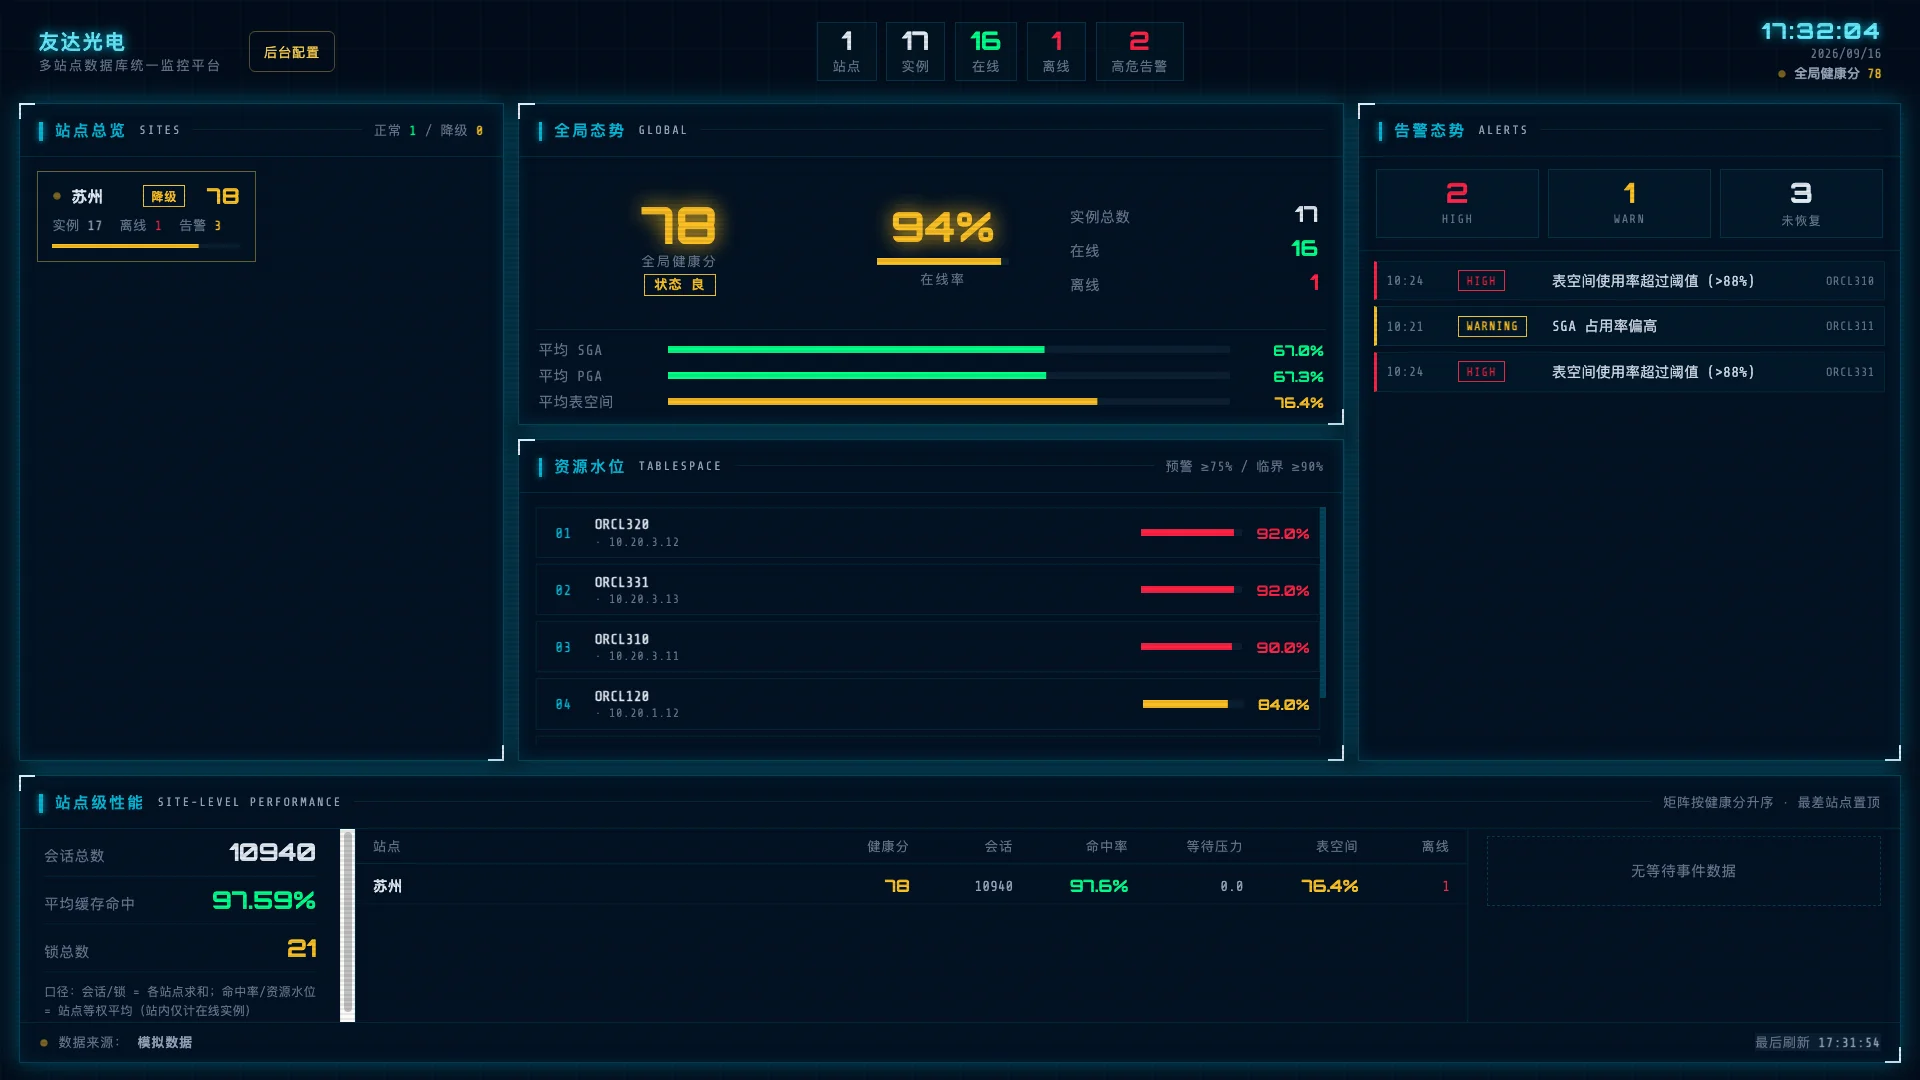
Oracle database instances across three sites — Kunshan, Suzhou and Vietnam — managed in real time on one screen. DBAs no longer log in site by site; they open the dashboard and see the whole picture.
Cores Semiconductor
Semiconductor · Unified monitoring + operations dashboard
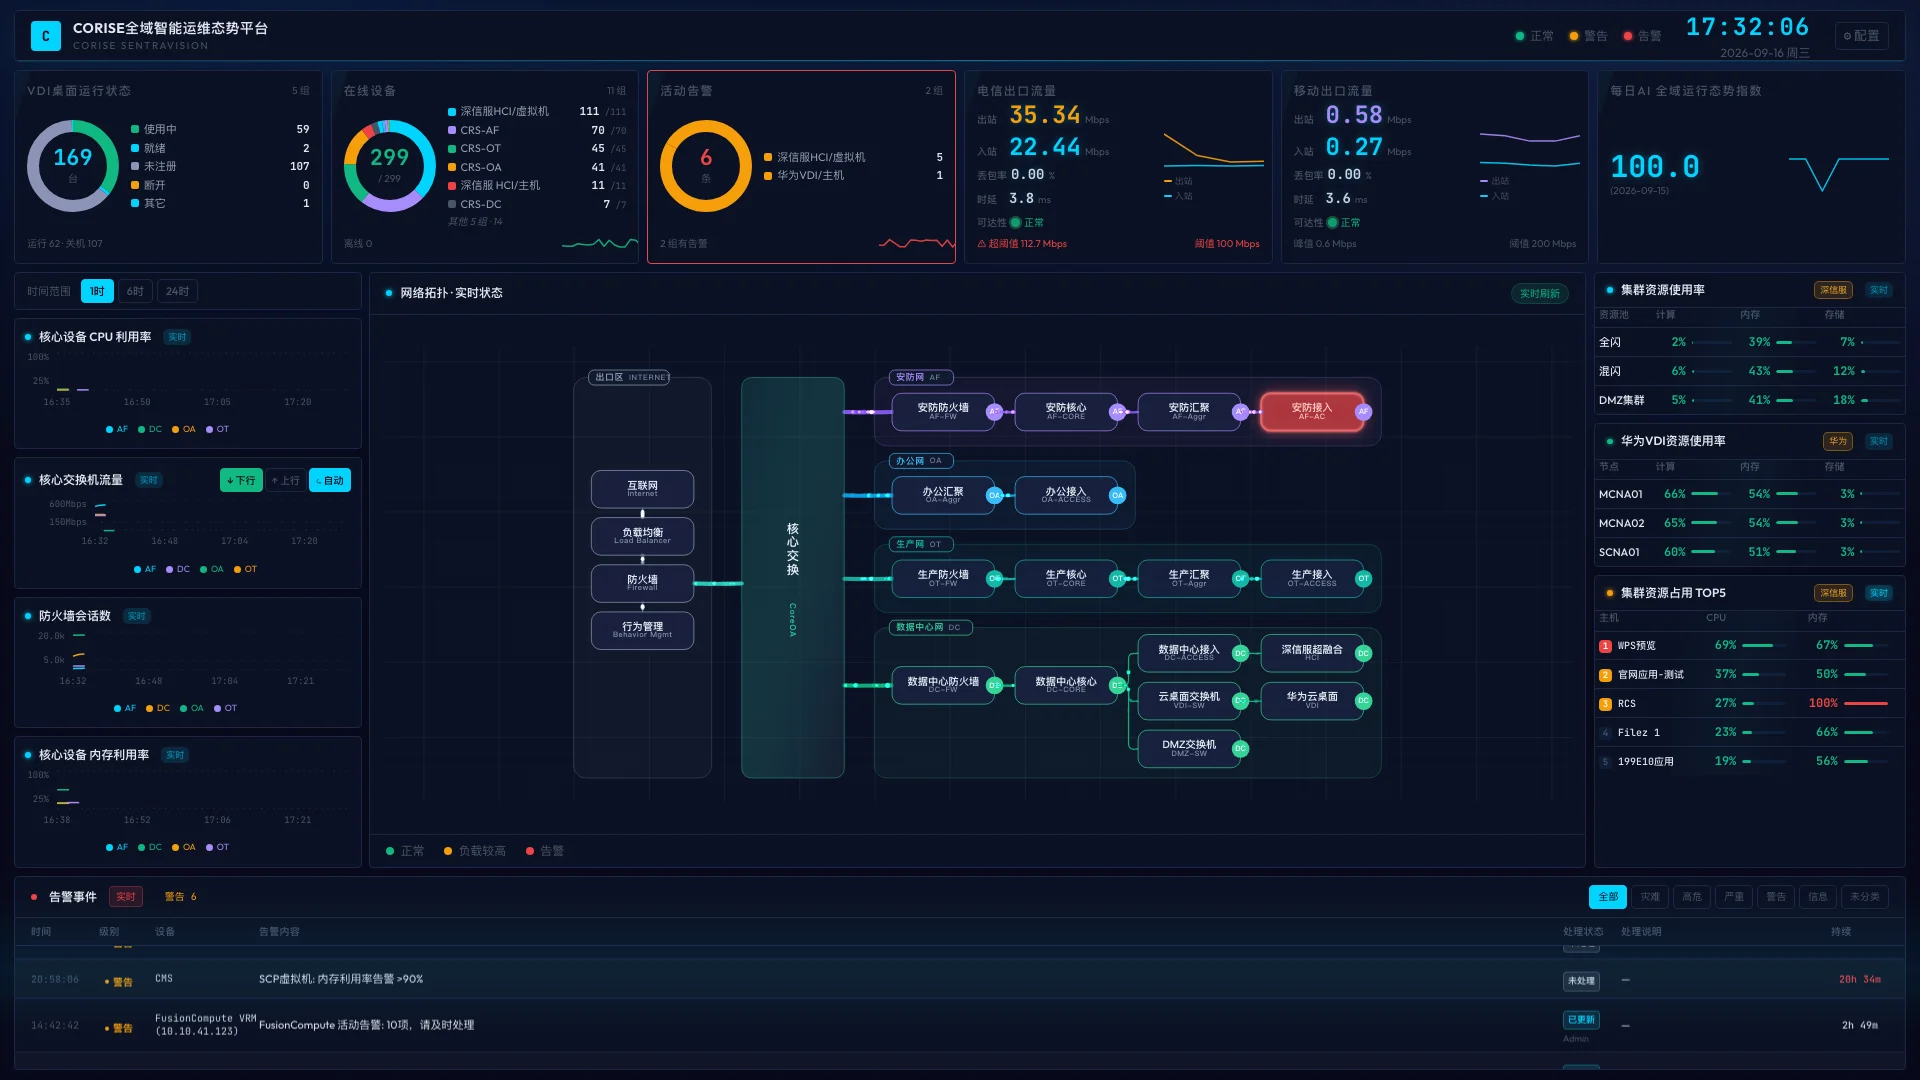
Cleanroom environment, MES, PLC controllers and server clusters used to run independently — you only found out when the production line stopped. Now they are managed together, with the operations overview dashboard displayed in the control room.
AU Optronics
Optoelectronics · Multi-site manufacturing
- What hurt before
- AUO runs several production lines across Kunshan, Suzhou and Vietnam, with Oracle databases on three sites. Health status, performance metrics and slow-query data all had to be checked by DBAs logging into each machine manually — half a day to inspect a single site.
- What we did
- Connected an Oracle collector to the Zabbix platform and brought all three sites' database instances under management. We then built a multi-site Oracle dashboard showing tablespace usage, SGA hit ratio, active session count and slow-query TOP 10 in real time on one screen, with views switchable by site and instance.
- What it delivered
- Daily inspection time dropped from half a day to 15 minutes: DBAs open the dashboard and immediately see which site has a problem, and management can see database health across the production lines in real time.
Cores Semiconductor
Semiconductor · Unified monitoring + operations dashboard
- What hurt before
- Cores' semiconductor lines involve cleanroom environment monitoring, MES, PLC controllers and server clusters. Each system ran independently with no single place to see overall IT status, so problems were often discovered only when the production line stopped.
- What we did
- Used Zabbix to bring all IT and OT devices under unified management, then built an operations overview dashboard deployed in the operations centre. It shows device online rate, alert distribution, network topology, bandwidth usage and cleanroom temperature/humidity exceptions in real time, so operators in the control room have full situational awareness.
- What it delivered
- Fault discovery moved from "the line stopped" to "the dashboard raised an alert". MTTR fell from an average of 45 minutes to 8 minutes, and the team shifted from reactive firefighting to proactive response.
Alerts no one has to watch, reports no one has to write, faults no one has to fix
AIOPS connects to Zabbix and turns monitoring data into executable operations actions. People sleep; the system keeps working.
Automated inspection
Replacing manual effort, it covers every asset managed by the monitoring platform and produces standardised inspection reports. No one needs to log into Zabbix and check items one by one each day.
Automatic report generation
Daily, weekly and monthly reports distributed automatically by email or to Lark/DingTalk groups. Management sees health, operations sees trends, compliance sees the log — each gets what it needs.
Fault self-healing
Automatically handles over 70% of common faults: full disks trigger log cleanup, dead services restart, expiring certificates renew. Handling time drops from hours to seconds.
Trend prediction and early warning
Predicts resource bottlenecks and risks from historical data, warning 7–30 days ahead. You do not wait until the disk hits 99% — at 85% you already know it needs expanding.
Resource and cost optimisation
Automatically identifies idle virtual machines, under-utilised storage and expiring certificates. Expand what needs expanding, reclaim what should be reclaimed, and cut IT cost by 10–30%.
Business SLA assurance
Round-the-clock inspection of core business systems with fast fault detection and localisation. No human duty rota — the system watches itself and responds to problems in seconds.
Root cause analysis and handling
When Zabbix fires an alert, OpenClaw logs into the target host to investigate, pinpoints the root cause, fixes it directly where possible and gives operating guidance where not. It does not tell you "the disk alerted" — it tells you "unreleased PGSQL idle connections pushed memory high; they have been cleared, and we recommend adding a connection timeout setting".
Natural language queries and reports
Send one sentence — "plot the 7-day CPU utilisation trend for the database servers" — and OpenClaw pulls the data from Zabbix, computes the average and peak, and produces a visual chart. No configuring filters item by item in the Zabbix console.
Multi-IM platform integration
Supports Lark, DingTalk, WeCom and other channels. Operators talk to the bot directly in the IM tool they already use, with no platform switching. Alert push, command dispatch and report delivery all happen in one window.
Automatic alert closure
Zabbix fires "disk usage > 90%" → OpenClaw cleans the logs automatically → pushes the result to the Lark group. Time-synchronisation alerts are repaired directly without human involvement. From alert to closure, fully unattended.
Not "theoretically possible", but numbers from production
Three layers working together, from monitoring to self-healing
Zabbix "sees", AIOPS "thinks", OpenClaw "acts". Each product owns one stage; together they form a complete intelligent operations loop.
One conversation shows you how much lighter operations can be
Thirty minutes to talk through your current monitoring setup and what hurts. We will give you a workable plan you can use as reference even without a project.